Please download the complete Q4 2019 market report here or contact your Radius broker for more information.
 |
Q4 Commercial Sales Summary: Sales volume jumps notably in 2019
Another big quarter helps push annual commercial sales to $531.0MM
As we predicted, 2019 came to a close with South Coast commercial sales activity following similar suit to 2018, buoyed by a strong 4th quarter. We continue to see the market stabilizing.
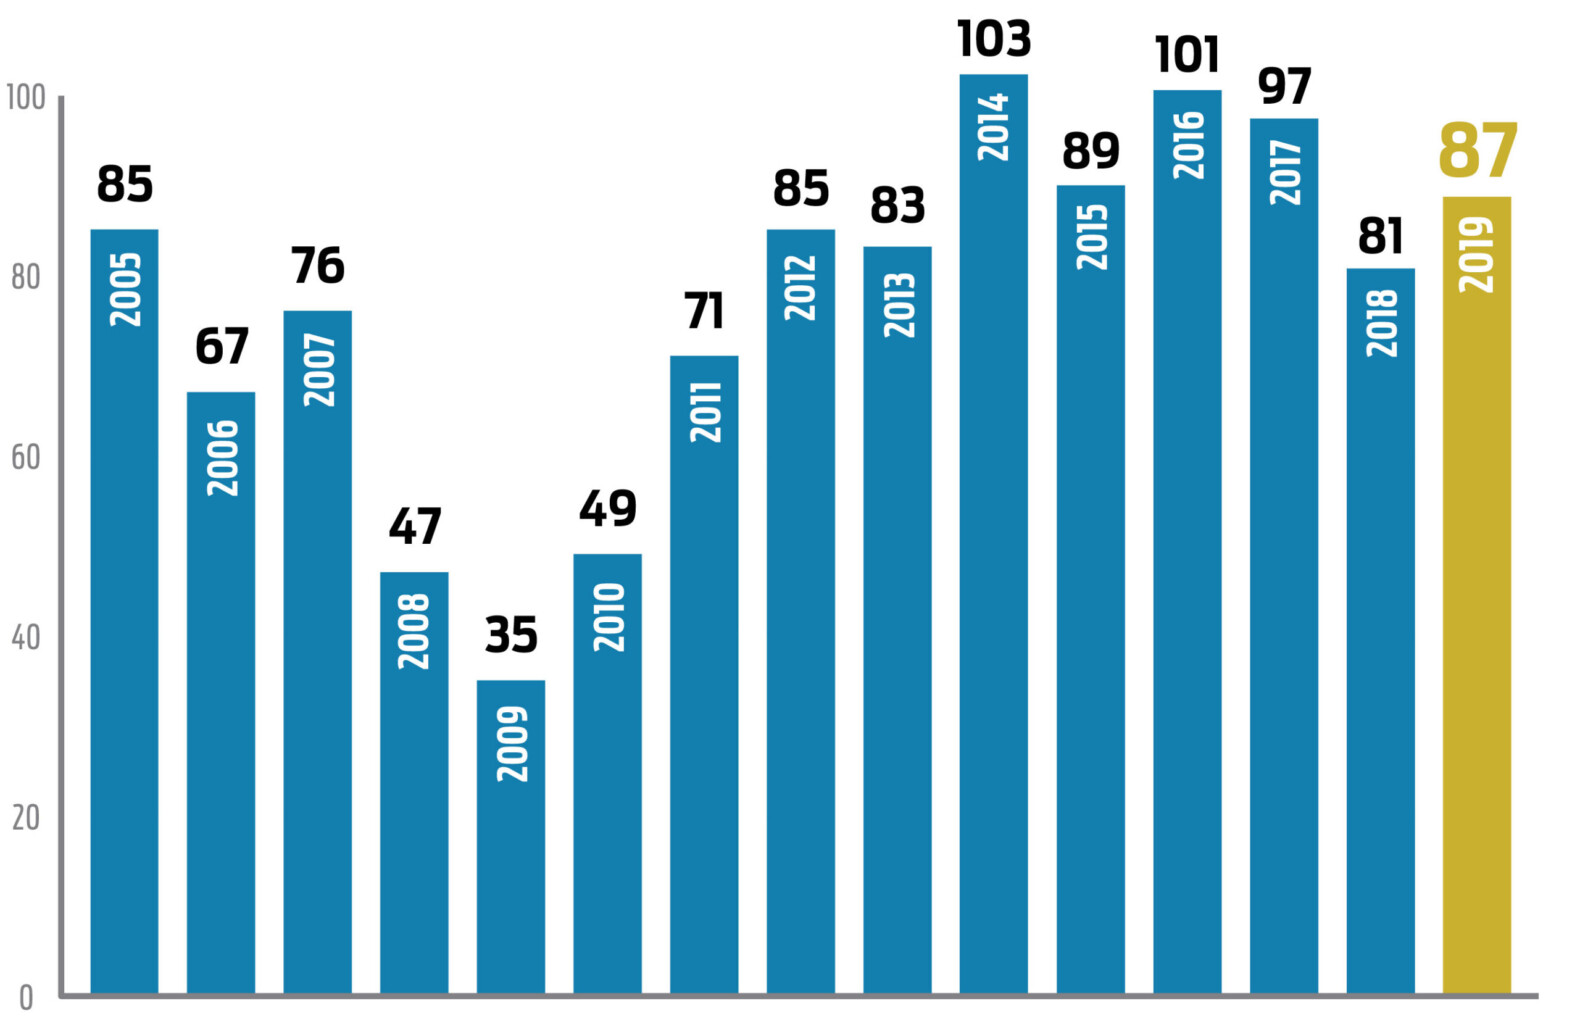
Despite the similar number of sales transactions, there is a notable difference between 2019 and 2018 fiscal year sales volume totals. In total, 2019 concluded with 87 transactions and approximately $531.0MM in sales volume, a hearty 52% increase over 2018 which ended with 81 transactions and $350MM in sales volume.
While the sales count on the South Coast is very much on the shallower side when compared to the previous 5-year average of 94.2 sales, when compared to the 15 year average of 77.1 sales we are on the positive side of the trend.
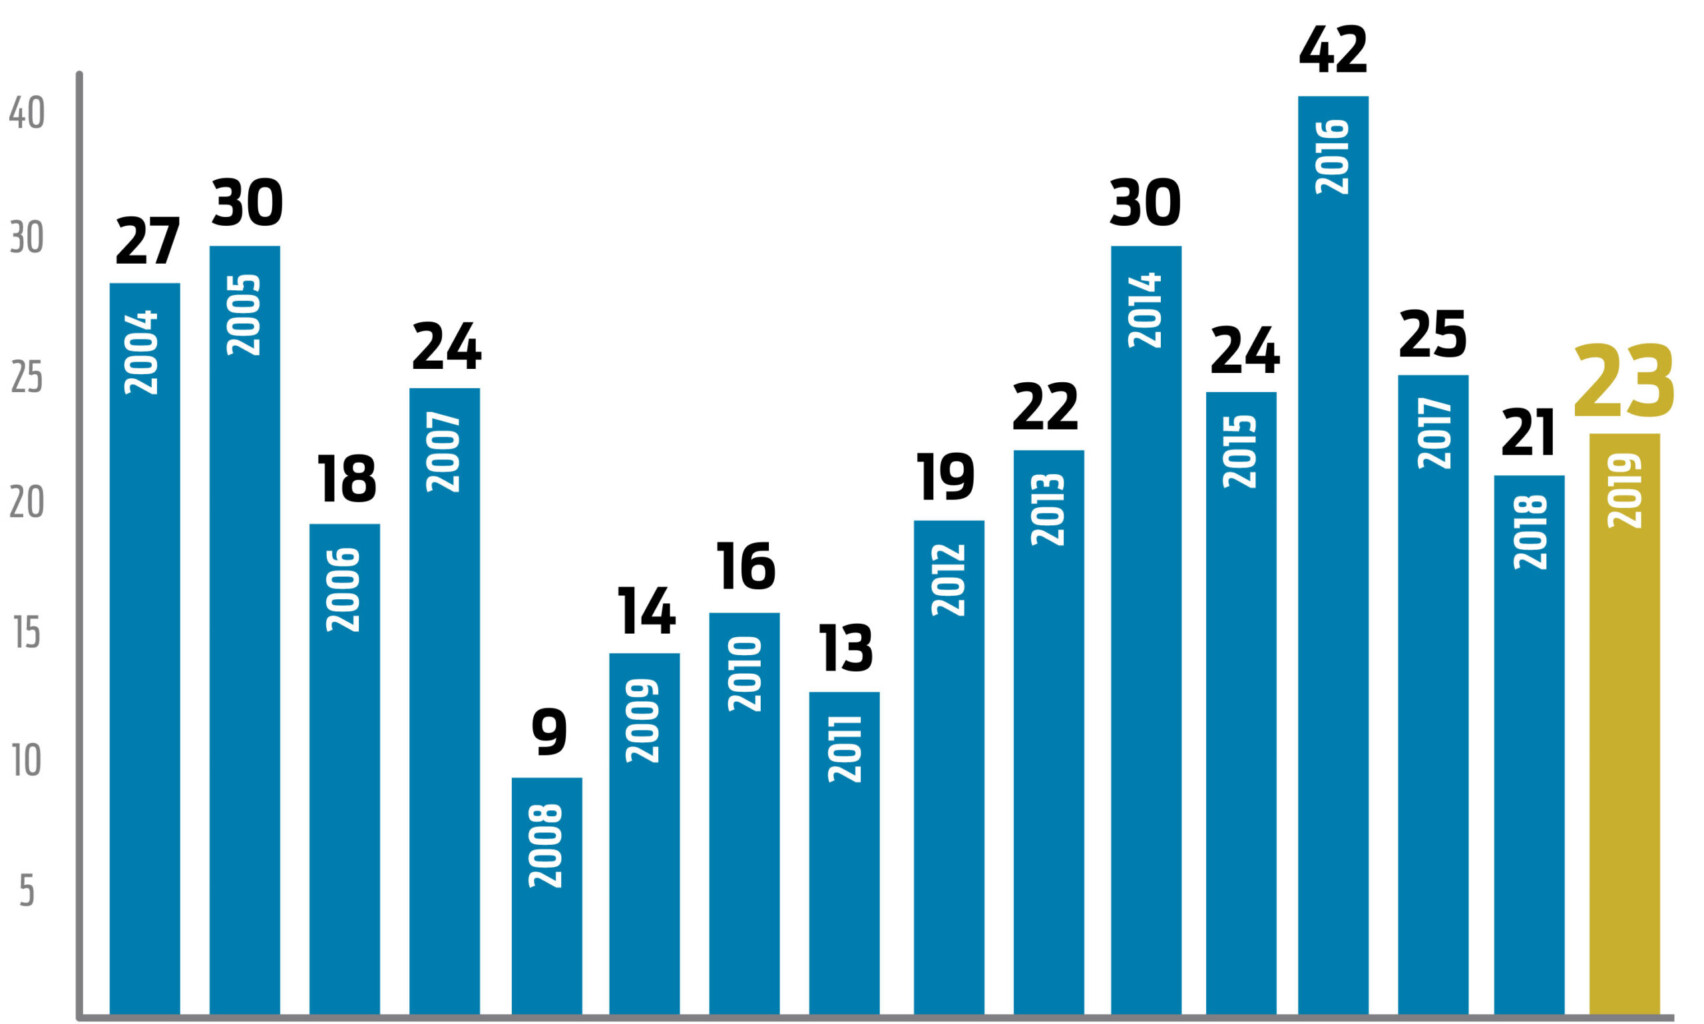
In fact, the fourth quarter of 2019 concluded with 29 transactions and $210.6MM in sales volume which was the strongest quarter of the year. In comparison, Q4 2018 concluded with 24 transactions and $168.1MM in sales volume. Further comparing quarters, we also saw growth in the number of properties traded in every category. For example, in all of Q4 2019 there were six industrial sales (five sales in Q4 2018), four land sales (three sales in Q4 2018), 15 office sales (11 sales in Q4 2018) and four retail sales (three sales in Q4 2018).
The largest South Coast commercial sale of the fourth quarter involved 3761 State St. The approximately 29,884 square foot building occupied by Whole Foods traded in December at a 4.6% CAP for $43.8MM. Not far behind was the sale of the 3-building Castilian Technical Center campus at 50–90 Castilian Dr. in Goleta which traded for $40.9MM, also in December. Also notable was the sale of 301 Mentor Dr. in Goleta, with the 69,054 SF building being purchased by Google for $23.6MM.
Important to note is the number of buyers who are owner-users versus investors. Investors made up 38% of the total Q4 sales while owner-users accounted for 62%. While only speculation, inventory may be the driving force.
Simply put, there appears to be more sellers with vacant buildings looking to sell at market prices because they have no income. At the same time it’s taking longer to sell leased investments due to the difference in price and return expectations between buyers and sellers. Not an unusual predicament, by the way.
 |
Q4 Leasing Summary: Santa Barbara Office vacancy rate flat for 2019, still high at 6.6%
Office
Santa Barbara’s office vacancy remained relatively flat during the second half of 2019 with vacancy ticking up slightly from 6.4% in the third quarter to 6.6% in Q4.
During the fourth quarter there were 19 new leases signed accounting for just over 29,000 square feet with the largest being Bright Market leasing 5,092 square feet at 200 E. Carrillo St. The largest available spaces remains 26,339 square feet at 402 E. Gutierrez St. and 19,000 square feet at 1020 State St., with a total of 337,975 on the market by the end of the quarter. Activity among existing vacant spaces has been limited.
Moving north to Goleta, the office market remains hot. The vacancy rate did increase marginally from 4.9% in Q3 to 5.9% in Q4, notably still below Santa Barbara’s office vacancy of 6.6%.
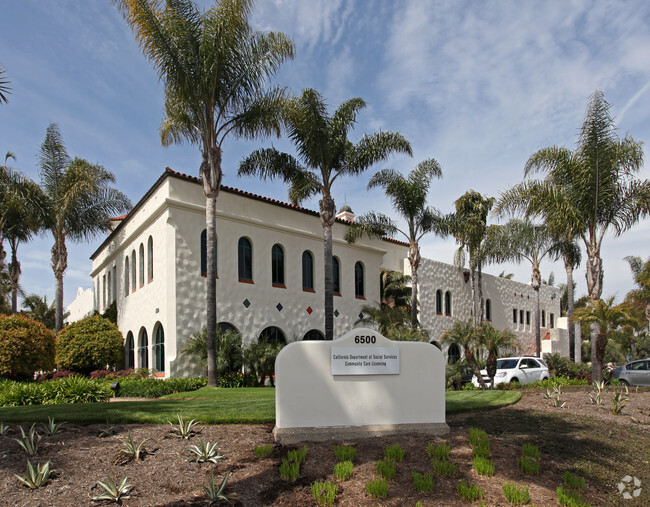
The largest vacancy by far at the end of 2019 in Goleta was the 82,132 square-foot space vacated by Medtronic at 125 Cremona Dr. There are multiple offers on the table for portions of this space. The largest new lease signed during Q4 was 29,372 square feet at 6500 Hollister Ave., leased to Strategic Health Care Programs. Not surprisingly Goleta office lease rates in 2019 increased in line with strong activity.
Headed down to Carpinteria, during the fourth quarter the office market vacancy rate rose from 3.9% in Q3 to 4.9% in Q4, not much of a difference considering how easily vacancy can swing in this limited inventory market. Case in point, the recent 5,433 SF vacancy at 1180 Eugenia Pl. alone was able to raise the vacancy rate. On that note, the only new lease of the quarter involved a 5,567 SF space in the neighboring property at 1160 Eugenia Pl.
The average gross asking rate lowered from $2.19/SF in Q3 to $2.07/SF in Q4, while the average gross achieved rate was $1.84/SF.
We expect Carpinteria vacancy to stay low through the next year as a lack of inventory, especially in the 2,000–3,000 SF range, continues to drive the market.
 |
Industrial
Not much exciting to report in 2019 in the South Coast’s industrial leasing market which remained stable during the fourth quarter with fewer overall new leases signed.
Santa Barbara saw just three new leases totaling only 3,400 square feet, while Goleta tallied only eight new leases totaling just over 44,000 square feet. There were no new leases in Carpinteria during the quarter.
The largest industrial lease in the South Coast in Q4 was 17,757 square feet at 859 Ward Dr., which leased to Curvature for their full-company relocation from 6500 Hollister Ave.
Vacancy rates remain virtually unchanged in Santa Barbara and Carpinteria and Goleta enjoyed a drop from 6.2% in the third quarter to 5.2% in Q4. The greatest demand for industrial space is in the sub-15,000 square foot range and we expect lease rates to remain flat/stable this quarter.
For the most part across the board there was a very slight decrease in average gross asking rates and achieved rates, but that is on the coattails of substantial increases for several years.
Retail
The Santa Barbara retail leasing market was relatively strong in Q4. Although only 11 new retail leases were signed, we did see positive momentum during an otherwise difficult time for retail. Downtown State Street in particular progressed somewhat with a handful of new leases, including a notable transaction involving the 11,450 SF space vacated by Samy’s Camera at 530 State St., which means there are now zero vacancies on the 500 Block. Also, while not a new deal, Urban Outfitters renewed their space at 624 State St. Given recent years, it’s certainly a sigh of relief when a specialty national department store chain decides to keep their doors open.
From a year-over-year vacancy perspective, the 3.8% retail vacancy rate did increase slightly from the 3.2% in Q4 2018. The average gross asking rate during the fourth quarter was $4.22/SF, with the average achieved rate at $3.09/SF. Summerland and Montecito had a slow Q4 with no new retail leases signed. However, Coast Village Road remains stable with strong lease rates and low vacancy.
At the end of the fourth quarter, there were 90 available retail spaces totaling just over 402,000 SF. As we enter the new year, gyms and fitness-related retailers continue to target Santa Barbara as a strong location to showcase their concepts to the active Santa Barbara community. We will continue to see turnover in the restaurant industry with exciting new offerings entering the market accompanied by more wineries and breweries.
 |
State Street Quarterly Retail Vacancy Update
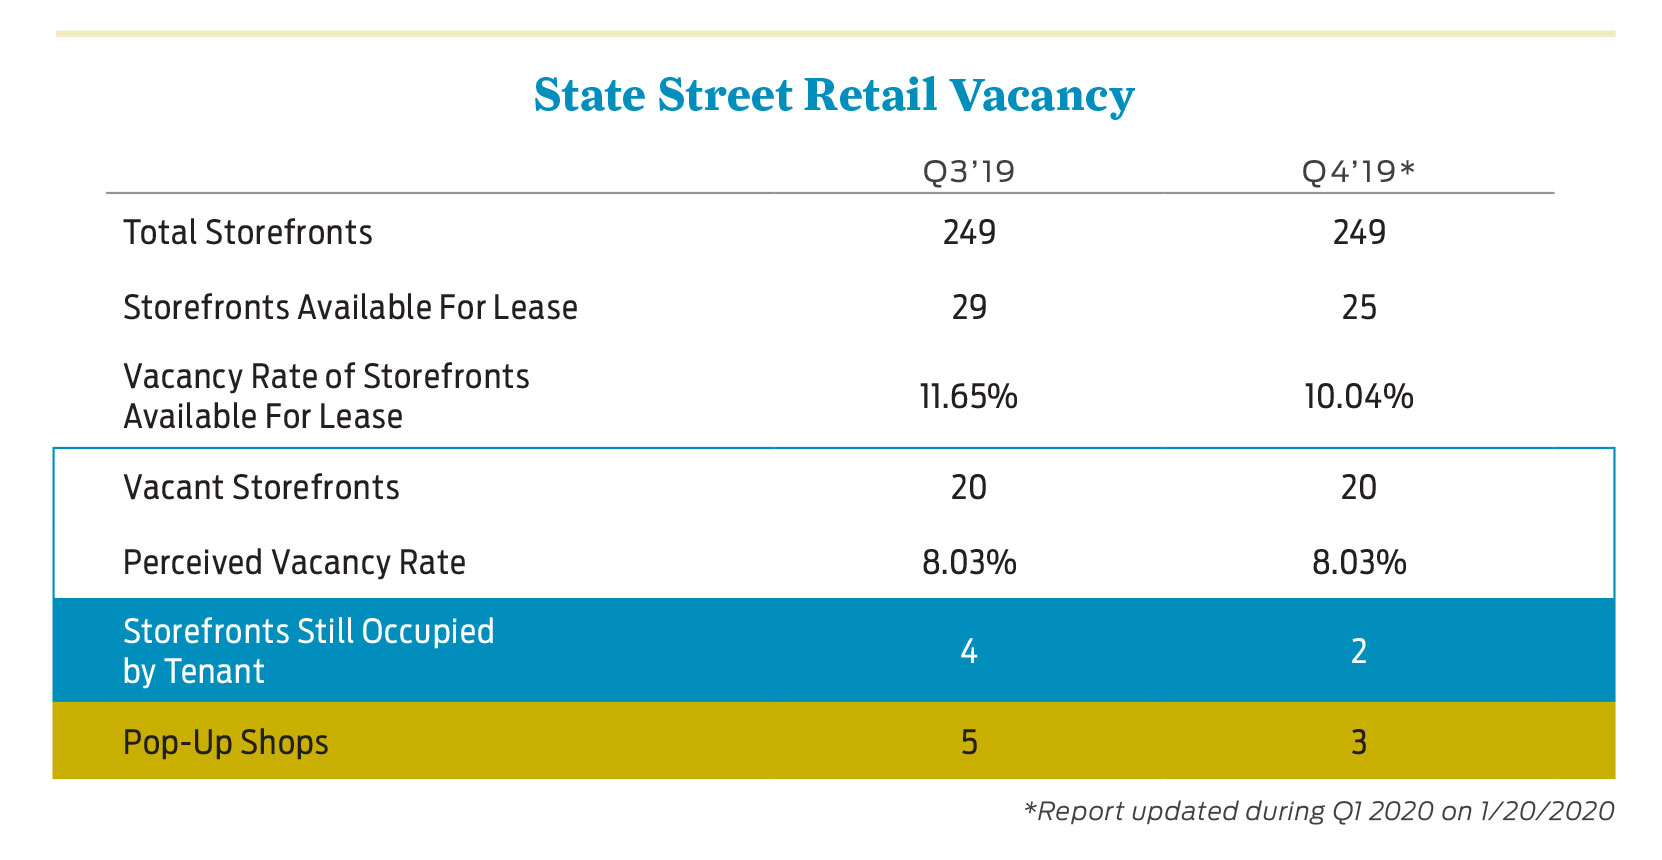
Radius conducts a monthly visual inspection and research of the downtown State Street corridor (400–1300 blocks). Vacancy rates are calculated based on State Street-facing storefronts only, excluding first floor office spaces fronting State Street. Some spaces may be leased and we are not aware. Pop-up shops are included in the vacancy rate given their short term status.
Summary
-
-
- State-us quo continues. We did see a slight drop in number of spaces available for lease from 29 spaces in Q3 to 25 spaces in Q4, yet total number of actual vacant storefronts remained the same at 20 which equates to a 8.03% perceived vacancy rate.
- New leases. There were just 3 new retail leases totaling 15,463 SF signed during the fourth quarter in additional to 2 notable renewals:
530 State St. — 11,450 SF (The Kitchen 530, LLC)
624 State St. — 10,217 SF (Urban Outfitters – Renewal)
921 State St. — 1,560 SF (Pink Blush – Renewal)
923 State St. — 1,673 SF (Lineacura US)
1321 State St. — 2,340 SF (Richard & Julie Schloss) - New vacancies. Three storefronts totaling 6,357 SF became vacant from the start of the fourth quarter:
809 State St. — 1,417 SF (Brighton Collectibles)
920 State St. — 1,360 SF (Closet Trading Co.)
1027 State St. — 3,580 SF (Tamira)
-
 |
Q4 Multifamily Investments Summary: South Santa Barbara County
The fourth quarter of 2019 continued to see little multifamily inventory in the South part of the county, following the trend we have seen over the past few years. The properties that did go active had substantial interest. Although off-market deals continue to be the norm due to a stockpile of buyers, the majority of sales this quarter resulted from on-market offerings, resulting in a flurry of activity and good results for sellers.
One such deal was Montecito Gardens (228 Castillo St. – 321 W. Montecito St.), a 21-unit complex sandwiched between West Beach and Santa Barbara City College that traded at a mid-3% cap rate. The property was originally in escrow off-market before being advertised, ultimately receiving several offers and going through multiple escrows before trading to an exchange buyer for $6,395,000.
Even with AB 1482 (the tenant protection bill that caps rent increases) now in place, buyers are still lining up to purchase properties like Montecito Gardens with potential upside and below market rents, and we haven’t seen any adverse effects on pricing so far.
Two additional assets that sold during the quarter after being brought to market were 806 N. Nopal St. and 221 W. Micheltorena St. These two properties are in good but not perfect locations for Santa Barbara, and thus sold at slightly higher cap rates of 4.2% and 4.5% respectively. With interest rates as low as they are and with a surplus of buyers, now remains a good time to be both a buyer and seller in the market.
Recent News
Noozhawk: Build Housing, Open State Street and Ease up on Landlords, Speakers Say at Radius Annual Economic Forecast
We live in the nicest place in the world. But there’s one way to make it nicer: Build housing. That was the advice …
Pacific Coast Business Times: South Coast commercial real estate sales see strong 4Q
Commercial real estate sales in Santa Barbara County’s South Coast market saw a major uptick in the fourth quarter of 2024 …
California Commercial Real Estate News Roundup 2023
We put together an updated list of transactions, lease highlights, and development projects around California's commercial real estate market. The list …