 |
Q2 2021 Commercial Sales Summary: Back on track in Q2?
Commercial sales rebound with investors continuing the charge
While we may not be entirely out of the woods with Covid and its repercussions, it is safe to say that great strides have been made as we get back on track to the likes of a normal year. While momentum slowed in the first quarter of the year after a strong Q4 2020, the second quarter of 2021 fared better, bringing back the healthy trends we saw in the humming times of 2019.
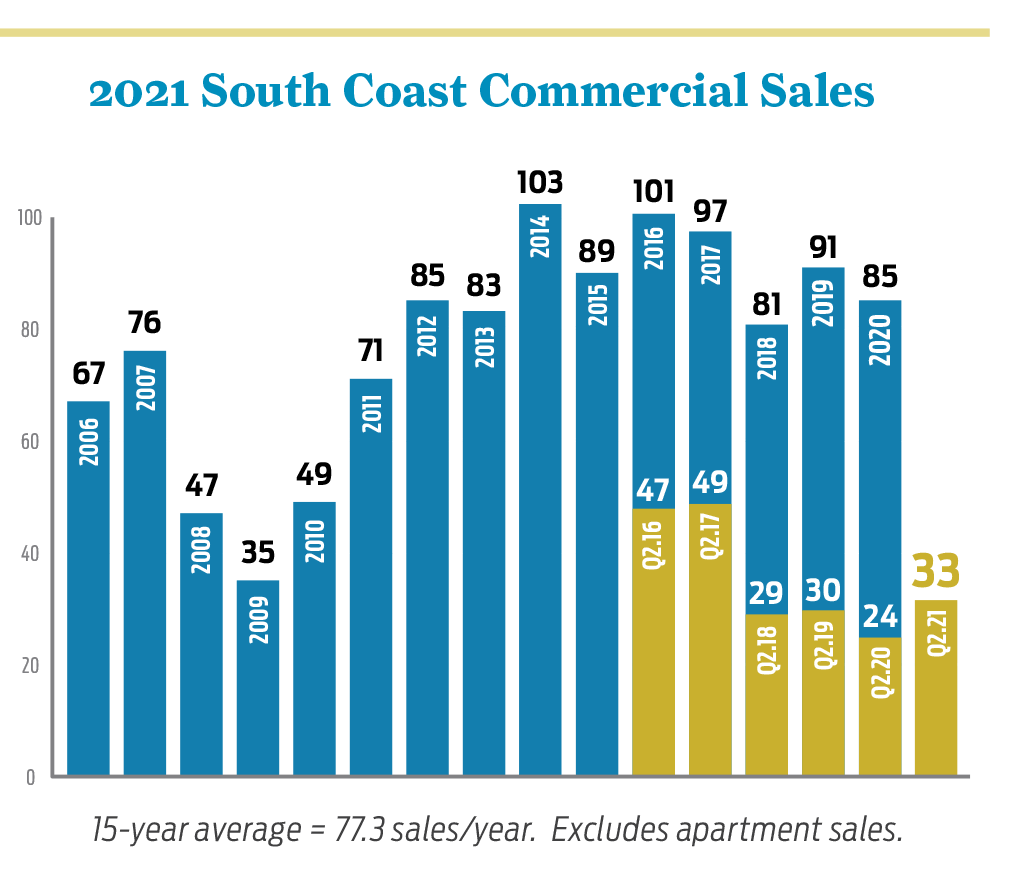
Looking back a year ago, we experienced the worst quarter in the last decade with just nine (9) commercial sales in Q2 2020. Fast forward to the halfway point of 2021 and we appear to be headed in a positive direction. The second quarter of 2021 produced 21 total sales, an uptick from the 12 recorded in Q1 2021, and six (6) more than Q2 2019 which had 15 total. Volume more than doubled in the second quarter, coming in at $90.2MM, up from $41.4MM in Q1 and far outdistancing Q2 2020’s lackluster performance of $14.2MM.
As we reach the halfway point of the year, with 33 total sales to date we are still trending below the 15-yr. average of 77.3 sales per year, but that is also due to our continuing dearth of available quality investments. However, more importantly, things are feeling like normal again based on buyer sentiment as well as overall activity.
Digging into the details, investors again led the market with 11 of the 21 sales in the second quarter, a trend we also saw in the previous quarter. A surprising stat to note is that the majority of the buildings sold were retail, however most of those properties are likely to be repurposed to multi-tenant or mixed-use. The total breakdown shows nine (9) retail sales, six (6) office, four (4) industrial and two (2) land sales.
A few noteworthy sales during the quarter include the 3-property Funk Zone commercial portfolio selling for $10.35MM, in addition to three off-market sales including The Lobero Building at 924 Anacapa St. ($16.5MM), 110 Castilian Dr. in Goleta ($16.1MM), and 205 Anacapa St., also in the Funk Zone, which fetched $1,108/SF or $4.25MM.
Market fundamentals continue to be strong with a lack of inventory and high demand coupled with a healthy lending market and low interest rates. As we push further out of Covid, the remaining half of the year should follow suit.
Q2 2021 Leasing Summary
Office
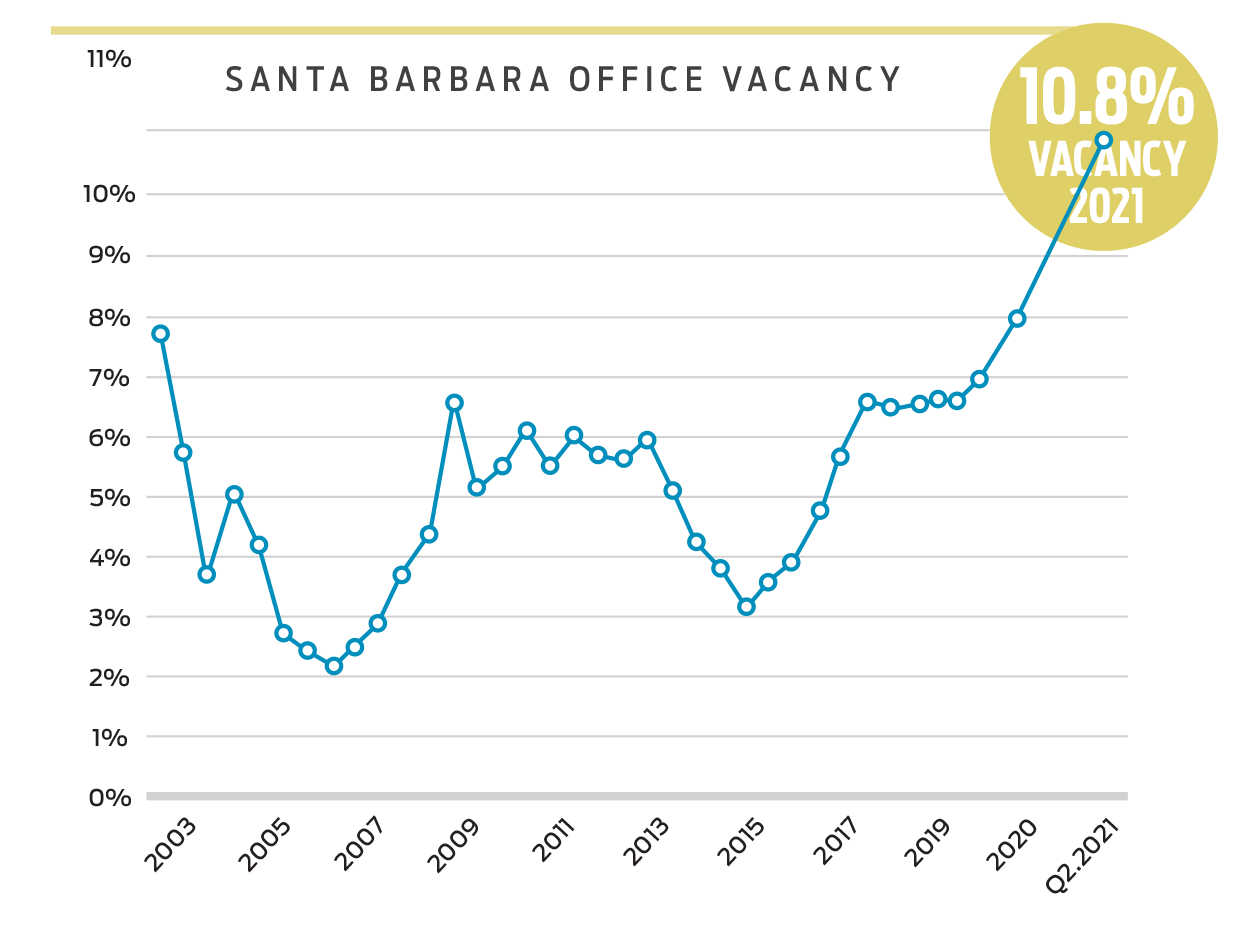
Santa Barbara’s office sector saw little change in the second quarter, with the vacancy rate ticking up to 10.8% from 10.0% in Q1 2021. This figure may jump notably if the approx. 140,000 SF big-box anchor building formerly occupied by Nordstrom in Paseo Nuevo Mall transitions to office use. In this case it will push our vacancy rate to around 13.5%.
We remain hopeful Nordstrom can be converted (likely rebuilt) to become apartments/residential to help stimulate renewal in downtown Santa Barbara.
Meanwhile, after sitting with a number of larger vacancies for years, 200 E. Carrillo St. (the 4-story Freitas Building at the corner of Carrillo and Santa Barbara streets) is now fully leased with four new leases totaling 15,021 SF executed in 2021.
 |
The Goleta office market showed many positive indicators of steady growth and recovery in the second quarter and we are hopeful that the market will continue its positive trend into the next quarter. The vacancy rate dropped slightly from 6.4% in Q1 to 5.6% in Q2. Another positive indicator of this steady growth is the average gross asking rate moving up from $2.00/SF in Q1 to $2.19/SF in Q2, while the gross achieved rate also rose between quarters, from $2.06/SF to $2.16/SF.
There were nine (9) new leases totaling about 57,000 SF during the second quarter, all of them under 5,000 SF with the exception of one large lease of 40,487 SF at 7414 Hollister Ave., the former LogMeIn space, taken for $2.01/SF on a 5-yr. term to a company called L3 Technologies Inc.
In the smallest of the submarkets we track, the Carpinteria office market, there remains a lack of inventory. Hopefully the new, yet-to-be-constructed office buildings at 6380 Via Real will break ground shortly. There are currently only three office spaces for lease, and during the second quarter there were just three new office leases totaling 4,707 SF.
Industrial
On the industrial leasing side, this sector remains very stable throughout the South Coast market with vacancy rates in Santa Barbara, Goleta and Carpinteria all declining during the second quarter. In fact at 0.6%, Santa Barbara’s vacancy rate is at its lowest since late 2018.
Industrial lease rates—both asking and achieved—continue to increase in Santa Barbara due to very limited inventory, while Goleta and Carpinteria lease rates are relatively unchanged.
Some highlight industrial leases for the second quarter include 19,400 SF at 1015 Cindy Ln. in Carpinteria, 34,000 SF taken by Kate Farms at 30 S. La Patera Ln. in Goleta, and 12,500 SF to the Tent Merchant at 411 E. Gutierrez St. in Santa Barbara.
The largest Santa Barbara vacancy is just over 8,300 SF at 4179 State St., while in Goleta the former Skate One site at 30 S. La Patera Ln. is the largest vacancy at just under 67,000 SF.
Industrial activity should continue the trend of stable vacancy and leasing activity through the next quarter with, again, the primary factor being the market’s lack of inventory for tenants.
Santa Barbara Retail
During the second quarter there were a total 16 new retail leases signed for just over 30,000 SF. These lease transactions ranged in size from 458 SF – 4,700 SF. The three most notable deals include a lease of approx. 4,700 SF to a new martial arts studio at 1107 State St.; Giffin & Crane’s sublease of approx. 4,387 SF at 800 N. Milpas St.; and Caribbean Coffee’s lease of approx. 2,864 SF at 220 E. Cota St. Also of note was Starbucks’ approx. 1,900 SF lease at 3052 De La Vina St., which was previously occupied by Coffee Bean & Tea Leaf.
On the vacancy front, Santa Barbara’s retail vacancy rate remained unchanged from last quarter at 4.3%. Asking rates for Santa Barbara retail have clicked up from last $4.00/SF last quarter to $4.22/SF gross equivalent (Base Rent + NNN) in Q2. Achieved rates have moved downward, going from $4.01/SF gross equivalent to $2.94/SF gross equivalent in Q2. Of course with a limited number of new lease transactions occurring, achieved rates can fluctuate dramatically. The true market rate of a retail building/space is dictated by the specific location and size of the retail asset (contact your Radius commercial representative regarding your retail property).
There is currently approx. 451,000 SF of retail space available for lease in Santa Barbara, with just under half of this total comprising space at both the former Sears building in La Cumbre Plaza and the former Macy’s building in downtown Santa Barbara’s Paseo Nuevo.
 |
Q2 2021 Multifamily Investments Summary
South Santa Barbara County
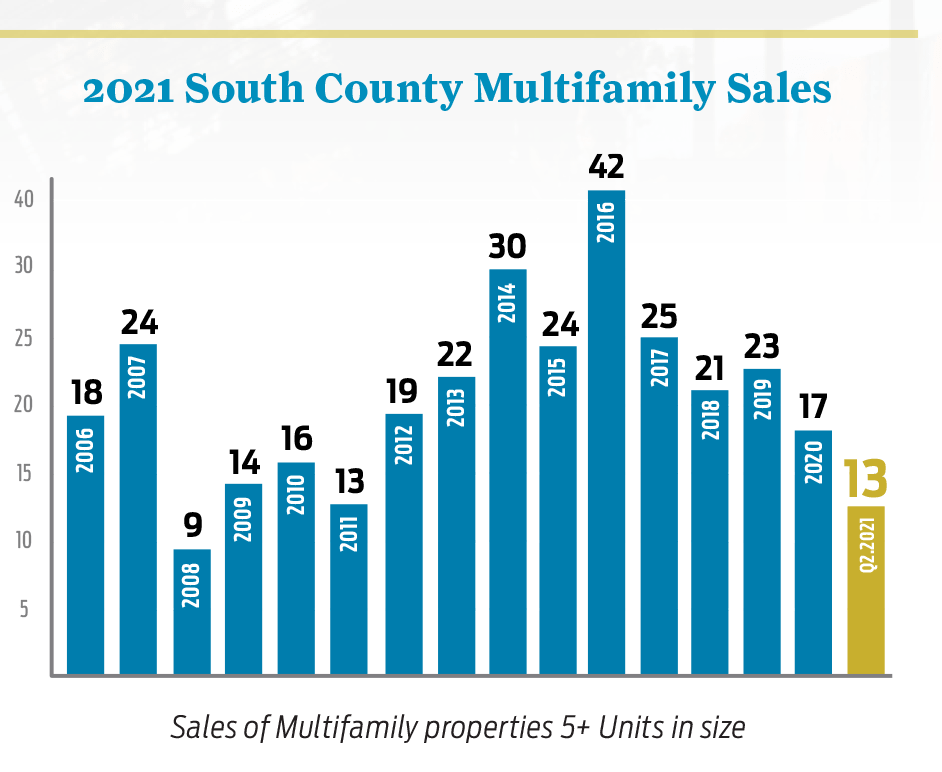
Sales activity during Q2 was considerably stronger than what we saw during Q1. The market remains incredibly strong with little inventory. We are still seeing multiple offers on many properties, which has driven up prices significantly. The vacancy rate has dipped to 3.3% from 3.8% a year ago, even while several rental communities delivered in 2020 remain in lease-up. There was a total of 24 multifamily investment transactions in Santa Barbara South County in Q2 of 2021, with seven (7) of those in the 5+ unit range and 17 in the 2–4 unit range.
The largest transaction in Q2 was at 201 Ladera St. in Santa Barbara, a 21-unit building which traded for $9,675,000 ($460,714/unit). The building featured (6) 3BD/2BA, (14) 2BD/1.5BA townhomes, and one studio. The highest price per unit in this unit range was a 7-unit portfolio in Isla Vista which sold for $4,447,047 or $635,292/ unit, while the average PPU for properties in this size range came in at $425,076, an increase from last quarter’s $409,288/unit. While technically right on the cusp of Q1 and Q2, one noteworthy sale in Northern Goleta was Wayside Village Mobile Home Park, a nearly 5-acre property with 70 mobile home spots which sold on March 31st for $10MM.
In the 2–4-unit range, the highest price per unit went to 520 Chiquita Rd., with this 2-unit property trading for $1,875,000 or $937,500/ unit. This was a notable jump from the largest PPU in Q1 which came in at $692,000/unit. The average price per unit for properties in the 2–4 unit range was $710,176/unit.
Two (2) significant sales took place in Isla Vista during Q2. A 3-unit building located at 6746 Del Playa Dr. garnered $2,798,142 or $932,714/unit. Also a portfolio consisting of three (3) properties, totaling seven (7) units sold for $4,447,047 at 635,292/unit. The average price per unit in Isla Vista during Q2 was $651,396. A very large portfolio currently in escrow is estimated to close in Q3.
North Santa Barbara County
A total of four (4) investment properties sold in the North County of Santa Barbara. The largest transaction in this region was located at 221 N St. in Lompoc, a 12-unit building which traded for $2,025,000 or $168,750/unit. The average price per unit in the North County was $169,063. Another notable sale was a 95 space manufactured home asset, which sold for $16,900,000.
W. Ventura County
In W. Ventura County, we saw five (5) transactions of 5+ units during the second quarter, the largest being a 12-unit building located at 176–182 Ramona St., which sold for $2,781,000. Additionally, a 16-unit building at 301 Signal St. in Ojai garnered just under $3.5MM or $319,091/unit. Another notable sale was at 534–542 S. F St. in Oxnard which traded for $2,428,500. In the 2–4 Unit range we saw three (3) transactions. The average price per unit in Ventura County in Q2 was $255,493.
Recent News
Noozhawk: Santa Barbara Community Weighs in on Proposed State Street Plan
When it comes to State Street, largely considered the heart of downtown Santa Barbara, everyone has an opinion. With the Santa Barbara City …
edhat: Santa Barbara South Coast Commercial Real Estate Sets Record at $361 Million
This marks the strongest performance recorded in the first quarter. Despite the record number, the largest came from two deals: first, the …
Pacific Coast Business Times: Radius Q1 report highlights record-breaking sales volume
Santa Barbara County’s South Coast commercial real estate market started off the new year with a bang, carried by the largest …